European power & gas fundamentals — cleaned, harmonized, ready.
Everything you need to explain what moved the market and anticipate what’s next: prices, generation, outages, flows, demand and more, in one place via a simple API and dashboards.
Free beta — no sales calls. Just data.
Fundamentals data and analysis, without the friction
Extract data in seconds
Clean API
Simple endpoints. No nonsense API codes. (e.g. /power/generation?area=ES)
One-click export
Download from charts (CSV / Excel)
Flexible output
Granularity, timezone, units
Power + gas in one hub
Unified workflow
Multiple commodities, one place
EU + GB coverage
No switching tools across regions
No broken scripts
Stop maintaining downloaders that break
Custom desk dashboards
Build your views
By market, zone, and metric
Save layouts
Reusable templates for your desk
Share fast
Export charts and links in one click
Ready to explore Axion Insights?
Get free beta access — no sales calls.
Built on trusted market data
Axion harmonizes data from trusted sources into one consistent schema so you can compare markets and export clean time series fast.

Powered by trusted sources
ENTSO-E: power prices, generation, load, flows, outages
ENTSO-G: gas flows and maintenances
GIE: gas storage and LNG data
TSOs: national-level detail and updates
Standardized for analysis
Aligned timestamps and timezones (DST handled)
Consistent units and naming across datasets
Revisions/backfills reflected when sources update
Coverage and availability can vary by market and dataset.
Ready to explore Axion Insights?
Get free beta access — no sales calls.
Market snapshots, deep dives on tendencies and desk-ready exports
Start broad, drill down when something moves, and export clean data when you need full control.
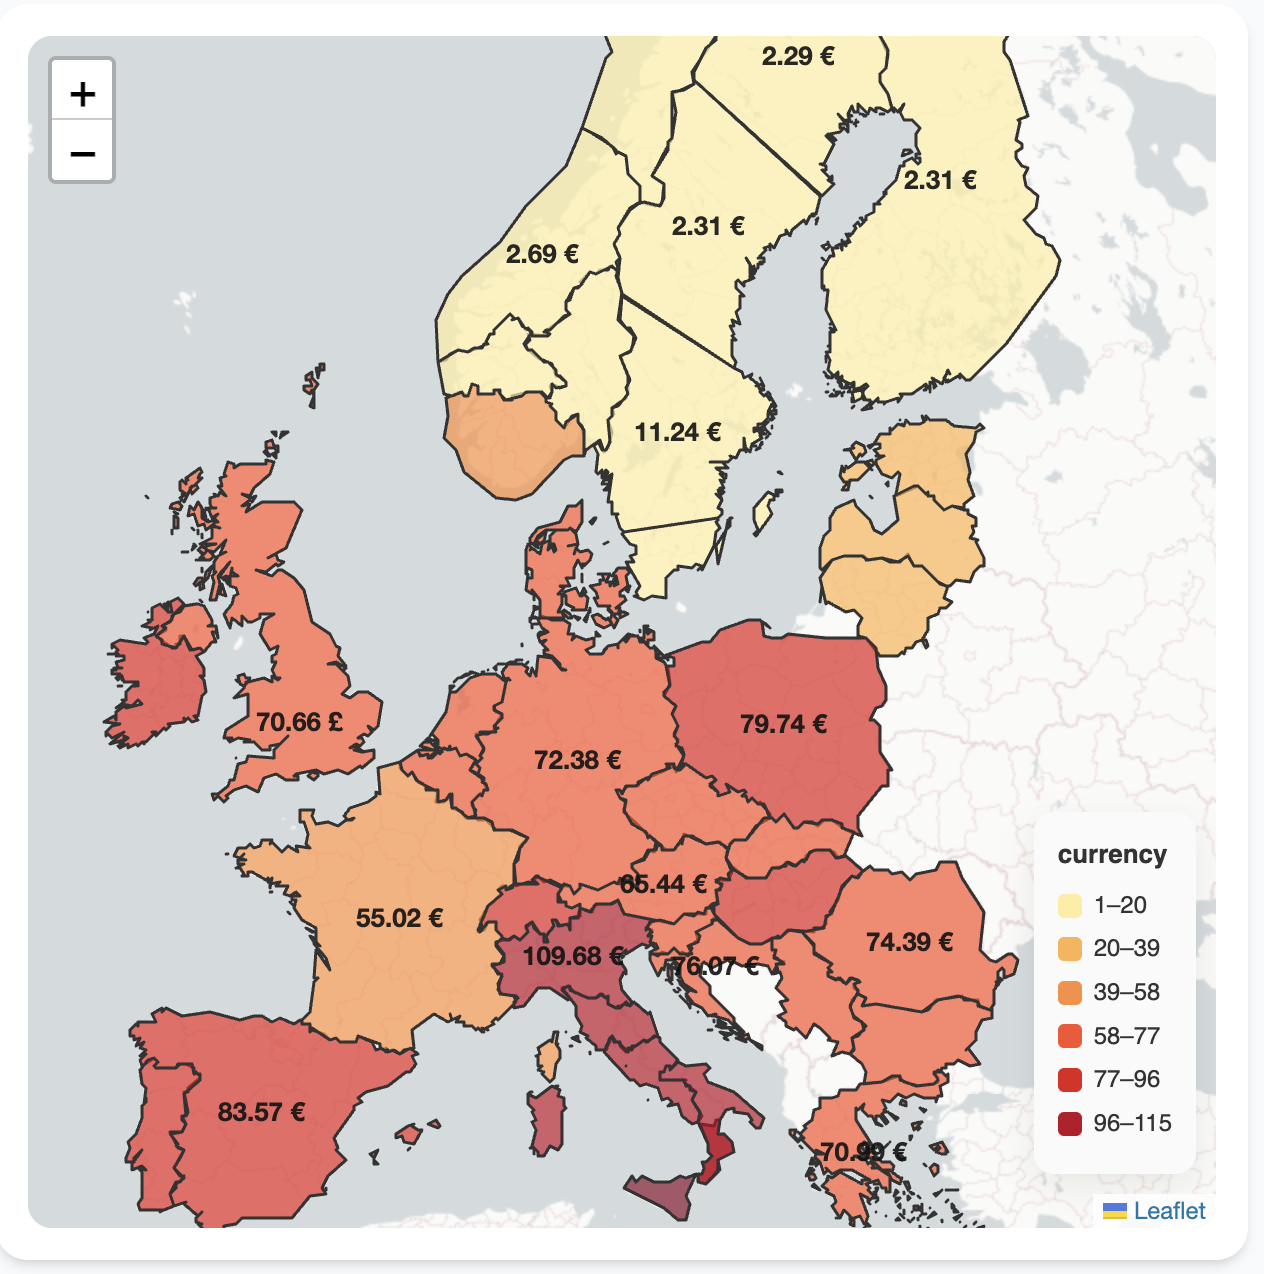
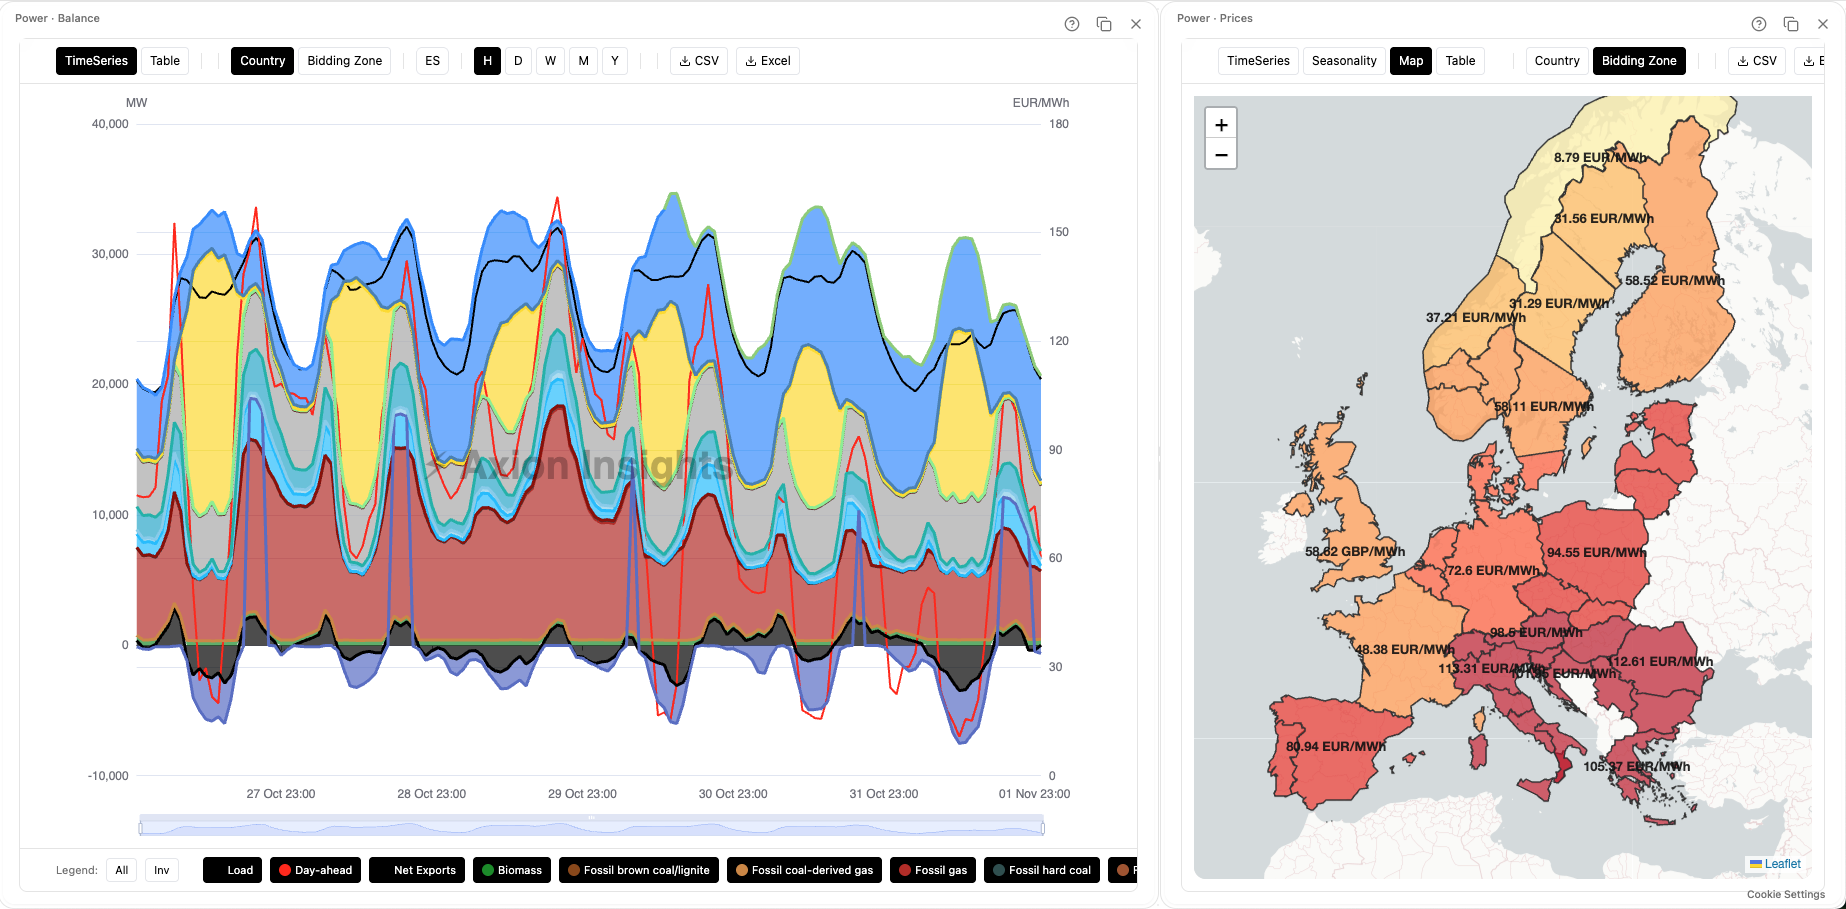
See what’s moving across Europe in one screen
Understand the story of the day: what moved, where, and why.
Prices & fundamentals by zone and country
Maps to spot outliers and regional patterns
Rankings: top movers and biggest deltas
One-click drill-down into any market
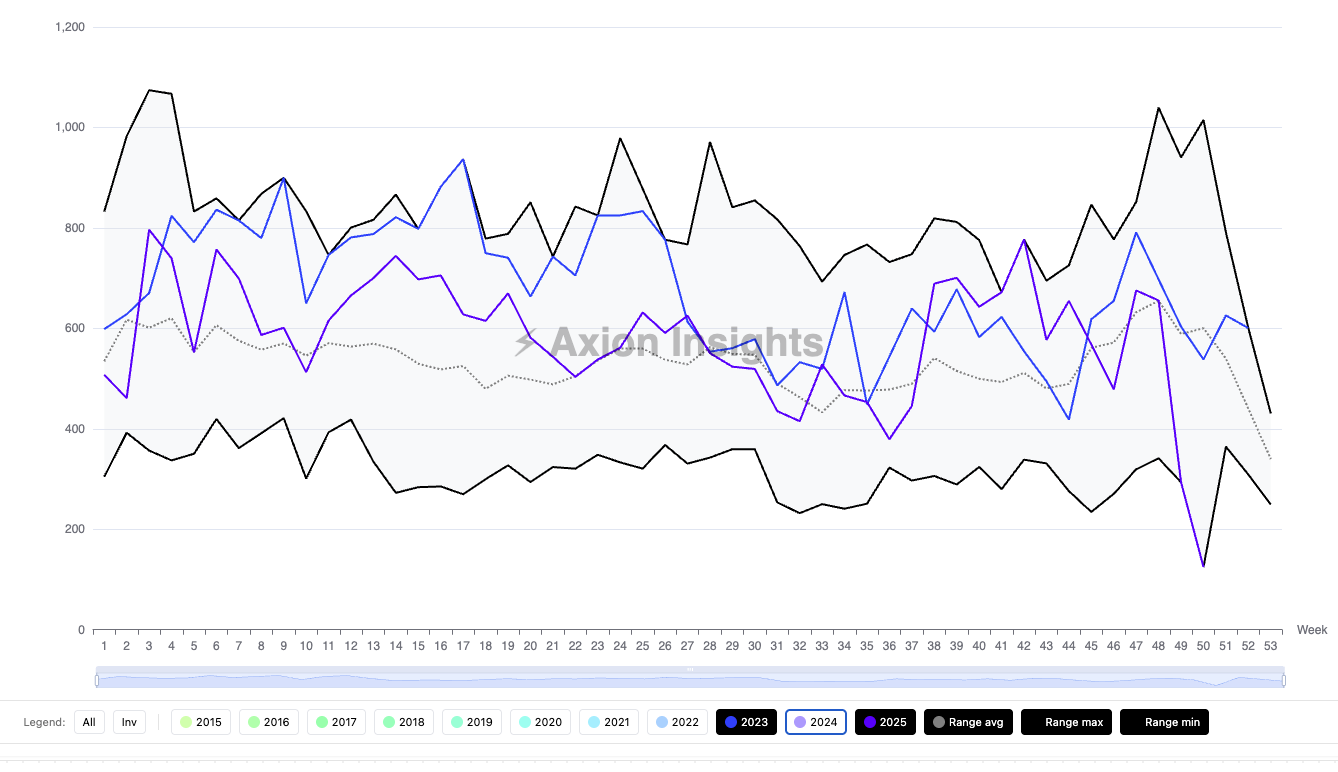
Seasonality & context in seconds
Answer “is this move normal?” with multi-year comparisons and driver-focused breakdowns.
Compare vs last year or multi-year ranges
Weekly/monthly seasonality views
Focus on one driver: wind, outages, flows, demand
Take it to Excel or Python
Export clean time series to Excel or Python in one click.
One-click CSV/Excel export from any chart
Same dataset available via API for notebooks/pipelines
Consistent timestamps, units, and naming
Simple and intuitive endpoints, no complex codes
API example
GETRequest
https://api.axion-insights.com/power/generation?area=ESSame dataset as the dashboards, export-ready.
What’s coming next
Beta users help us prioritize what ships first.
Now (beta)
LiveDashboards + API access
Power & gas fundamentals
CSV/Excel exports
Next
In progressWeather inputs & fundamentals
More forecast layers
Automated market reports
Later
PlannedAlerts & watchlists
Custom stacks & storage models
More markets and datasets
Have a must-have dataset or market? Tell us when you request beta access.
Join the Axion Insights beta
Free early access to dashboards + API. Help shape the product with direct feedback.
Free beta access (limited number of accounts)
Dashboards + API included
Priority on key markets and datasets
Direct feedback channel with the builder
Apply → we confirm fit → you get access.
Request beta access
Free beta — no sales calls. Just data.
Questions, answered
Short answers to the most common questions about Axion Insights and the beta.
Is the beta really free?+
Yes. Beta access is free for accepted users. If we introduce paid plans later, you’ll get clear notice and you can opt out anytime.
Will I get a sales call if I sign up?+
No. We only contact you about access, onboarding, and product updates. Any feedback call is optional and only if you want it.
Which markets and commodities do you cover?+
Axion focuses on European power and gas fundamentals. Coverage varies by market and dataset—if you request a specific country/zone, we’ll confirm what’s available in the beta.
How fresh is the data? Do you handle revisions/backfills?+
We ingest updates as they appear at the source and standardize timestamps, units, and naming. When sources revise or backfill values, Axion updates accordingly so your series stay consistent.
Can I export to Excel/CSV?+
Yes. You can export datasets directly from charts to CSV/Excel for reporting and ad-hoc analysis.
Do you provide an API?+
Yes. The same data you see in dashboards is available via a simple API so you can use it in Python notebooks, BI tools, or pipelines.
What sources do you use?+
We harmonize data from trusted public and market-standard sources such as ENTSO-E, ENTSO-G, GIE, Elexon and others (depending on the dataset).
What happens after the beta?+
We’ll share the roadmap and pricing before beta ends. If you don’t want to continue, you can leave—no contract and no hassle.
Still unsure? Explore our Handbook
All the markets and datset that we cover, our sources and methodology.
Built by analysts and traders for real trading workflows
We built Axion Insights because we were tired of expensive tools, fragmented coverage, and brittle scripts just to get desk-ready fundamentals. Axion focuses on clean data, fast context, and exports that fit how analysts and traders actually work: clear API, clear dashboards, no fluff.